Income Inequality in U.S. Cities
< < Go Back
There is a greater divide in income between the rich and the poor in the nation’s biggest cities than in the United States as a whole, says Alan Berube, a senior fellow and the deputy director of the Metropolitan Policy Program at the Brookings Institution.
As the concept of income inequality has swept the nation as of late, Berube’s study looks in detail at the income distribution within American cities. He notes that a city with just very rich and very poor citizens can have problems. The city may not be able to generate revenue from such a small tax base, and those who do rise to middle class status may simply move out of the city, as it could lack accessible housing and neighborhoods.
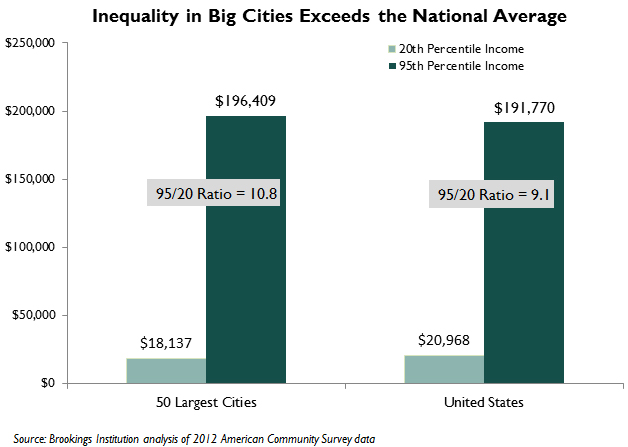
He uses the “95/20” ratio to perform his analysis. The ratio shows the distance between a household in the top 5 percent and a household in the bottom 20 percent. The numerator is the income at which a household earns more than 95 percent of all other households, while the denominator is the income at which a household earns more than 20 percent of all other household.
– In 2012, the average 95/20 ratio was 9.1, while the ratio in the 50 largest American cities was 10.8, indicating a greater distance between the two income groups. The “rich” figure was $196,000 for major cities and $192,000 for the United States as a whole, while the poor figure was $18,100 in cities versus $21,000 for the United States as a whole.
– Thirty-one of the 50 largest U.S. cities had a higher 95/20 ratio than did the U.S. average.
– The city with the highest ratio was Atlanta at 18.8 (with the top 5 percent at $280,000 and the bottom 20 percent below $15,000), followed by San Francisco, Miami and Boston.
– San Francisco’s top 5 percent earned $353,000, giving it a high ratio. Miami, on the other hand, made the top of the list because the bottom 20 percent make $10,000.
– The cities with the lowest inequality tended to be in the South and the West. Virginia Beach, Virginia, had the lowest inequality of the 50 largest cities, followed by Arlington, Texas; Mesa, Arizona; and Las Vegas, Nevada.
Of the cities that significantly increased their inequality ratios between 2007 and 2012 (San Francisco, for example, saw its 95th percentile income rise by $28,000 while its 20th percentile income dropped by $4,000), most saw incomes for those in the top 5 percent decline over that period. San Francisco is an outlier, as it was the drop in income of the bottom 20 percent over that period that made the ratio increase so significantly.
More From NCPA:


