As Wikipedia defines it, "a political spectrum is a way of modeling different political positions by placing them upon one or more geometric axes symbolizing independent political dimensions". The range of political positions in this country are universally understood to be encompassed by a spectrum from left of center to right of center. In the USA we typically consider the spectrum running left to right with
Socialists, Democrats,
Libertarians Republicans, and Conservatives. This spectrum is displayed visually in several formats, a
circle,
a half moon,
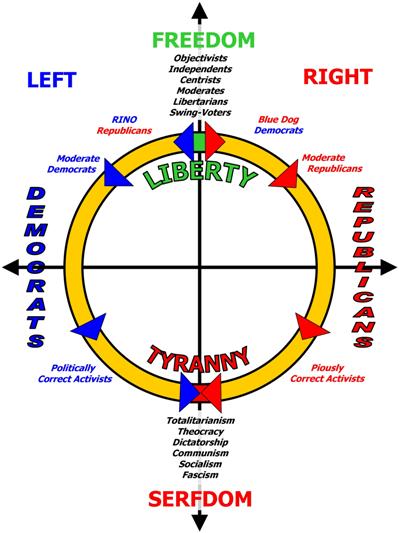
four quadrants,
compass chart, and two others we will explain below, a square box, and a straight line, etc. The most usual and easiest to handle is the
straight line. (This particular reference is just a sample. The plotting of particular people and beliefs is inaccurate.) Center being the true north of rational views on any issue. Left of center representing the more liberal or free thinking, unrestrained viewpoints. The right of center representing more conservative, traditional and responsible viewpoints. The
square box is based on the Nolan Chart created by libertarian David Nolan. There are variants of this model such as the
Pournelle chart developed by Jerry Pournelle in 1963, a two dimensional box chart but with different axis.
THE GRAY AREA HAS DEVELOPED ITS OWN GRAPHIC of 21st Century US Political Spectrum.
THE GRAY AREA HAS ALSO DEVELOPED A 2-Page GRAPHIC of ISSUES ACROSS the US POLITICAL Spectrum.(Page 1) (Page 2) Another variant is the "world's smallest political quiz" which rotates the Nolan chart to a diamond shape. The ADVOCATES for self government administers this quiz to help anyone quickly determine where they reside on the political spectrum.
Take the "world's smallest political quiz" to find out where your views reside on the spectrum. Another quiz is available from Dr. Tim Groseclose, a 40-question quiz that allows you to calculate your "Political Quotient". At the end of the quiz, Dr. Groseclose also lists politicians who have PQs similar to yours. Or, take the "
TIME Magazine quiz" to predict your political perspective. In the 3 columns below you will find updated stories on the political views (spectrum) of candidates and issues as they apply to us today.
How do your beliefs align with the political debates of today? Take the quiz. Various
Gallup polls on political spectrum by party, by individual groups, over the years.


