The Crap Behind the Q3 GDP Numbers
< < Go Back
By Tony Sagami,
I was raised on a farm and I’ve shoveled more than my share of manure. I didn’t like manure back then, and I like the brand of manure that comes out of Washington, DC, and Wall Street even less.
A stinky pile of economic manure came out of Washington, DC, last week and instead of the economic nirvana that it was touted to be, it was a smokescreen of half-truths and financial prestidigitation.
According to the newest version of the Bureau of Economic Analysis (BEA), the US economy is smoking hot. The BEA reported that GDP grew at an astonishing 5.0% annualized rate in the third quarter.
5% is BIG number.
The New York Times couldn’t gush enough, given a rare chance to give President Obama an economic pat on the back. “The American economy grew last quarter at its fastest rate in over a decade, providing the strongest evidence to date that the recovery is finally gaining sustained power more than five years after it began.”
Moreover, this is the second revision to the third quarter GDP—1.1 percentage points higher than the first revision—and the strongest rate since the third quarter of 2003.
However, that 5% growth rate isn’t as impressive if you peek below the headline number.
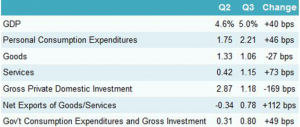
Fun with Numbers #1: The biggest improvement was in the Net Exports category, which increased by 112 basis points. How did they manage that? There was a downturn in Imports.
Fun with Numbers #2: Of the 5% GDP growth, 0.80% was from government spending, most of which was on national defense. I’m a big believer in a strong national defense, but building bombs, tanks, and jet fighters is not as productive to our economy as bridges, roads, and schools.
Fun with Numbers #3: Almost half of the gain came from Personal Consumption Expenditures (PCE) and deserves extra scrutiny. Of that 221 bps of PCE spending:
Services spending accounts for 115 bps. Of that 115, 15 bps was from nonprofits such as religious groups and charities. The other 100 bps was for household spending on “services.”
Of that 100 bps, the two largest categories were Healthcare spending (52 bps) and Financial Services/Insurance (35 bps).
The end result is that 85% of the contribution to GDP from Household Spending on Services came from healthcare and insurance! In short… those are code words for Obamacare!
Fun with Numbers #4: Lastly, the spending on Goods—the backbone of a health, growing economy—declined by 27 bps.
In a related news, the November durable goods report showed a -0.7% drop in spending, quite the opposite of the positive number that Wall Street was expecting.
I spend most of the year in Asia, including China, and I am seeing the same level of numbers massaging by our government as China’s.
That’s the financially dangerous world we live in, and I hope that you have some type of strategy in place to deal with the bursting of what’s becoming a very big, debt-fueled bubble.
More From Mauldin Economics:


